You can adjust the new dashboard to fit your individual requirements. You decide how and what data is displayed in your dashboard.
What benefits does the BidX-Dashboard have?
- Profit from our Best Practices
Use proven dashboards and optimize your amazon advertisement. - Stop wasting your time
Create an individual dashboard via drag & drop without manual effort. - Convey clear messages
Communicate your messages clearly via portfolio-clustering in the charts. - Easily make decisions
Select all relevant KPIs, analyze them and make better decisions easy. - Easily export your own dashboards
Customize your reports with our interactive exports
How can I proceed in my first steps?
We have set up the Standard-Dashboard "Home" with the most important KPIs (best practice). With just a few clicks however you can adjust your dashboard any time according to your preferences and export it with your corporate design.
Note: By default the data of the last 30 days is displayed.
How can I adjust the dashboard according to my requirements?
All KPIs in the form of charts and tables can be designed individually both in terms of content and graphics. You can either customize an existing dashboard or create a new dashboard.
I would like to adjust the KPIs from existing charts or tables in the dashboard:
Click on "actions" at the top right corner of the existing KPI as a chart or table. The "actions" button appears as soon as you hover over the according chart. Here you have the options to configure, rename or delete the chart.
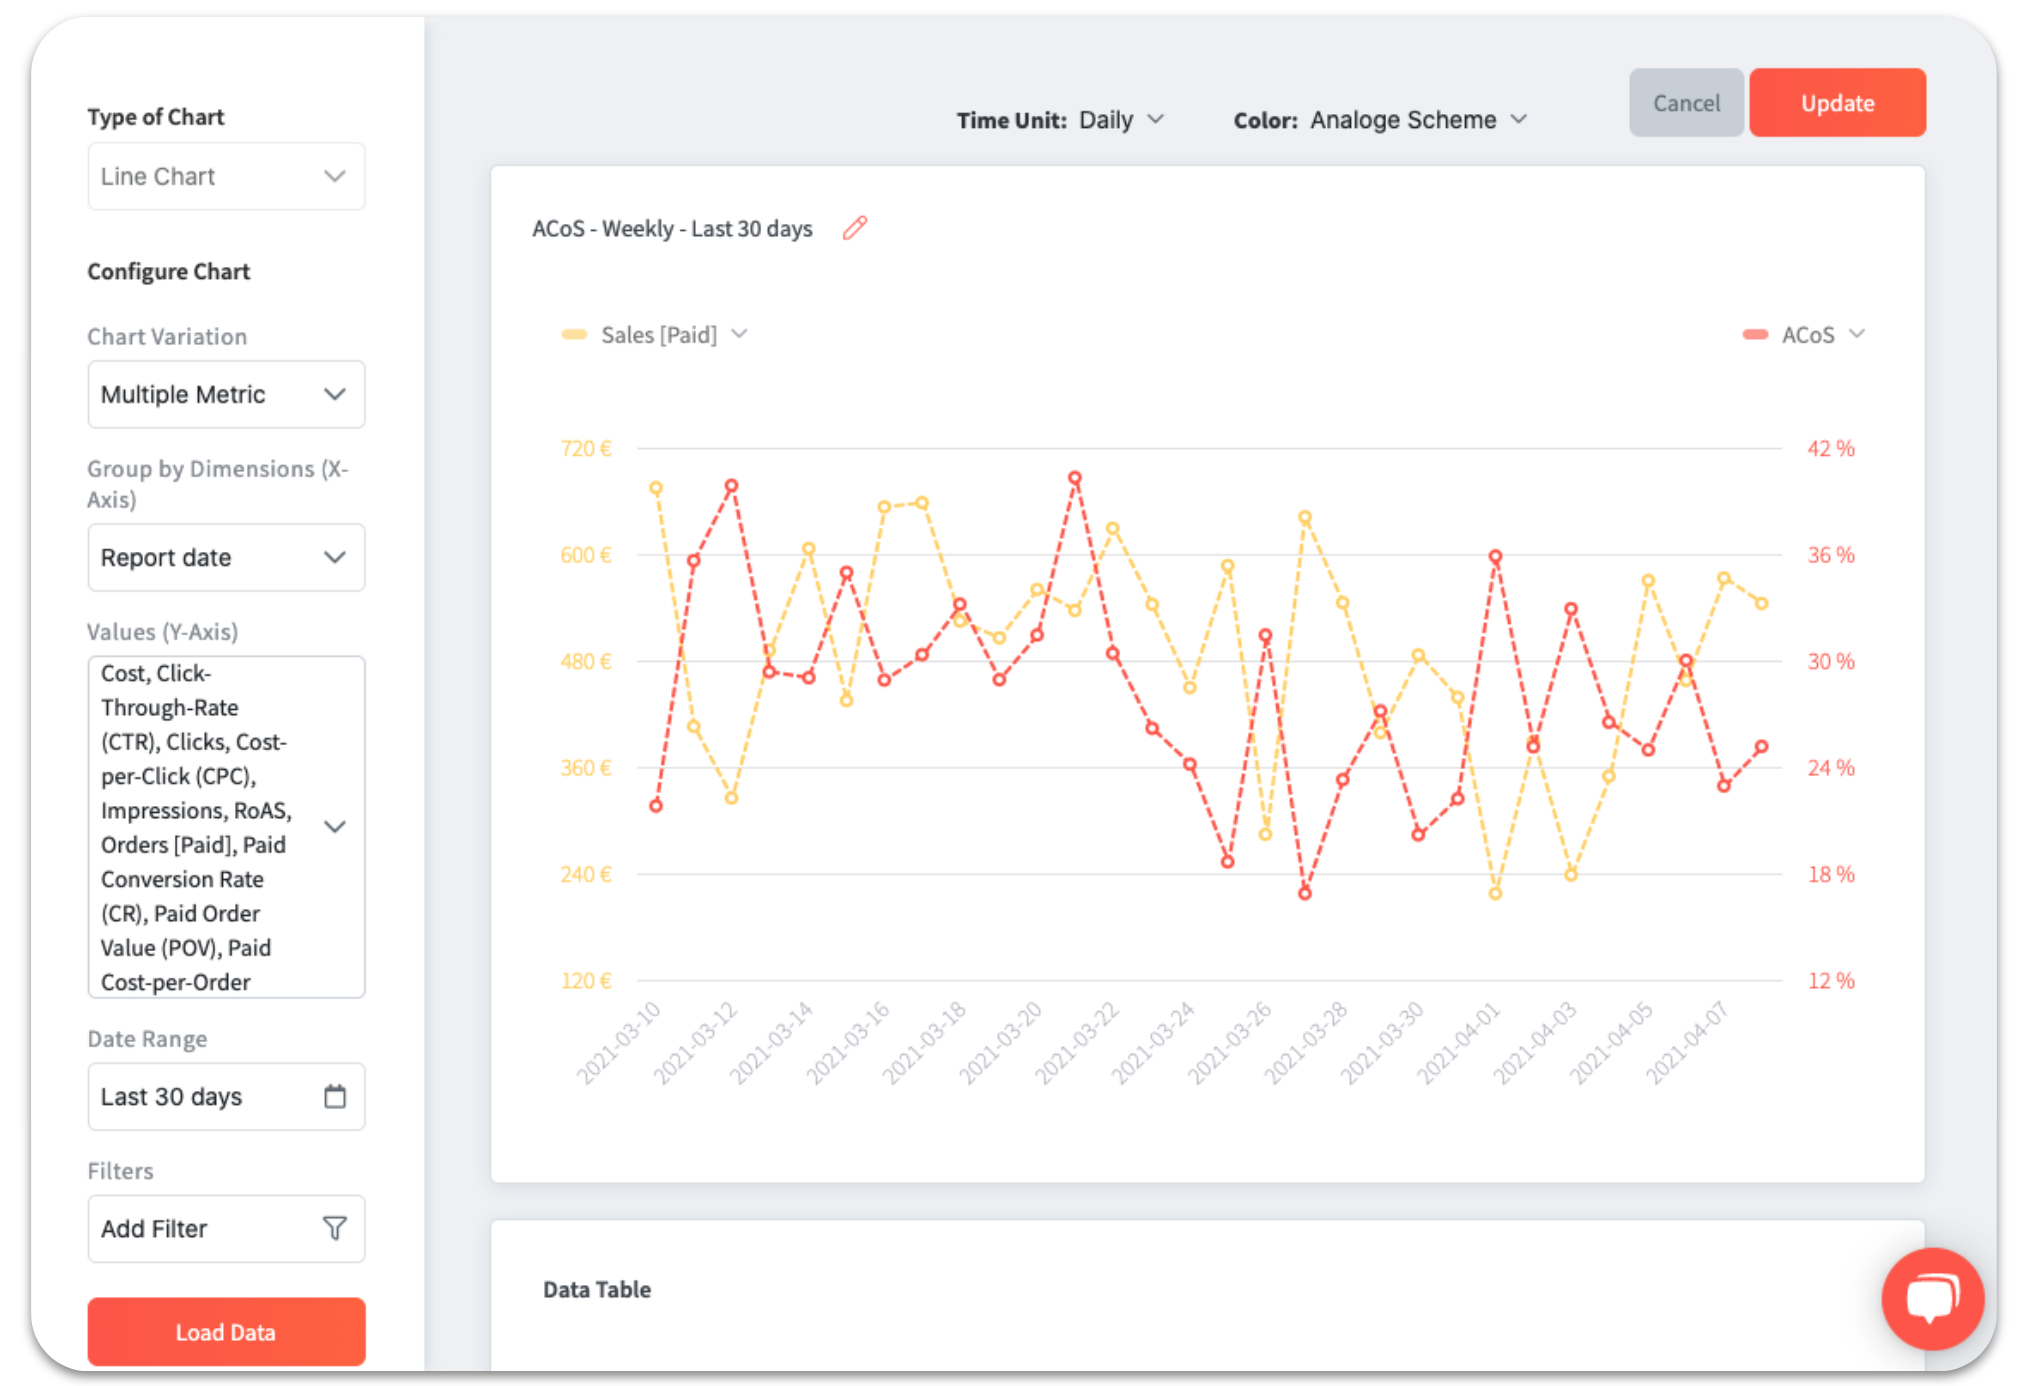
To make an adjustment choose "Configure Chart". Now you can adjust the KPIs according to your requirements.
Note: Here you can change the type of chart as well as set the date range as default. If you only want to see a specific market or ASIN, feel free to set a filter.
I would like to ad additional charts to an existing dashboard:
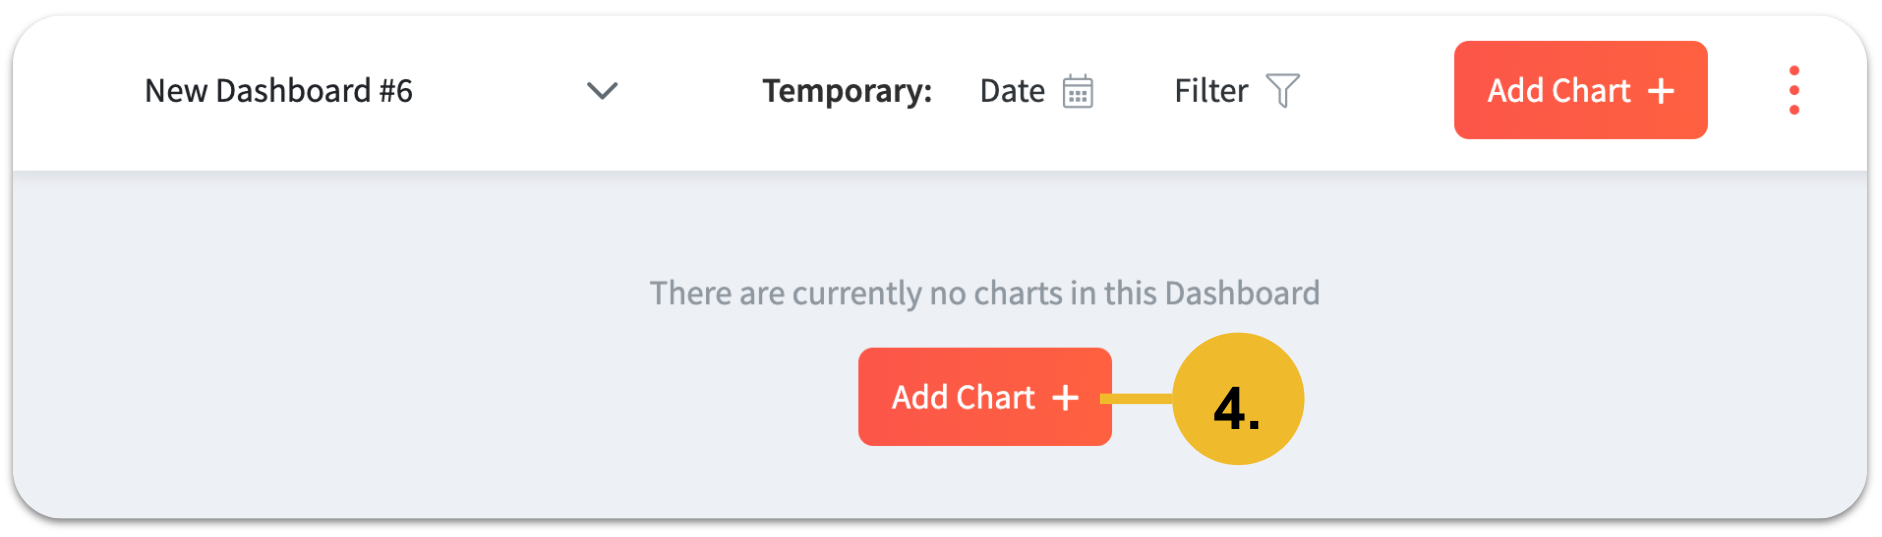
With just a few clicks you can add charts or tables to an existing dashboard. Click on "Add Chart" in the top right corner of your dashboard.

Now you can choose a chart type.
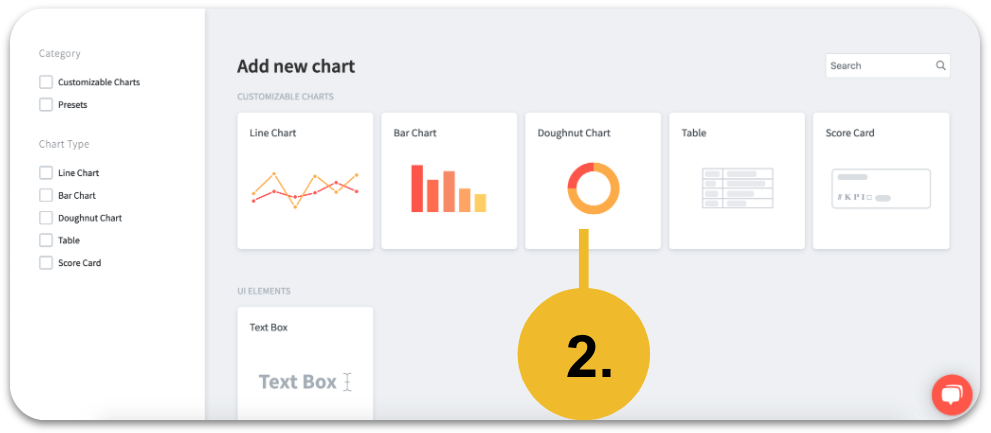
Note: You can use the "Text Box" to additionally create titles.
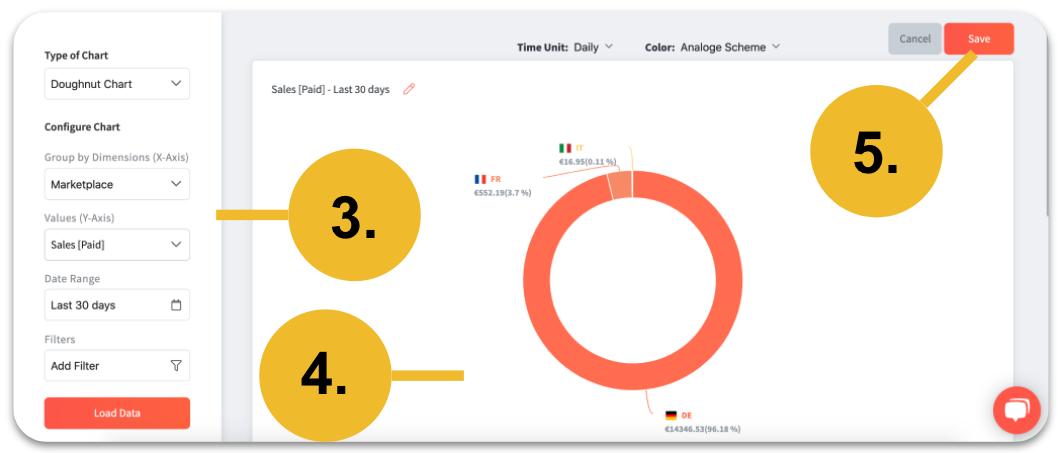
Please set the data according to your needs. Check your data directly in the preview and adjust your selection if necessary. Save the chart you have created. Ready!
I would like to create a new dashboard:
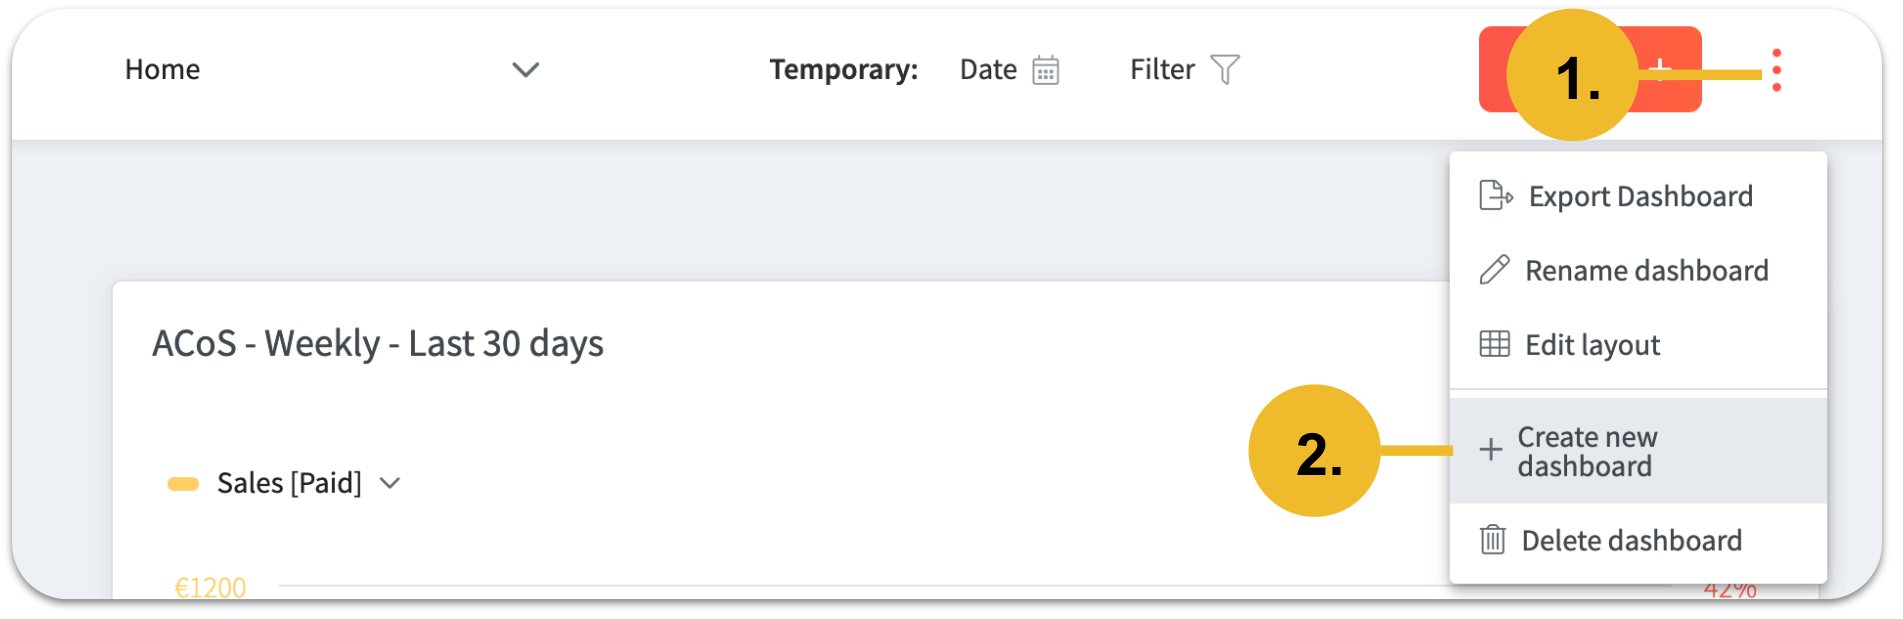
It is possible to create your own individual dashboard with just as few clicks. To do this you have to click on the dropdown menu. Then select "Create new dashboard".
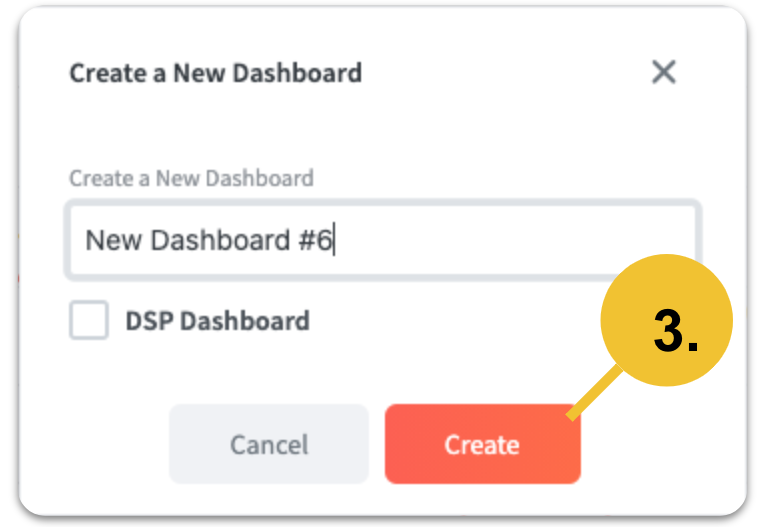
Now you can choose a name for your new dashboard and click create.
Create your charts for this new dashboard and position these per drag & drop.
Good to know: You can create several dashboards and change them any time with one click on in the dropdown menu in the top left corner.
Especially if you are selling products in different categories you can view your data much easier and faster as well as make better decisions.
You can easily change the name of your dashboard by opening the dropdown menu in the top right corner and then selecting "Rename dashboard".
If you don't like the design of you dashboard you can change the positioning of your charts and tables by selecting "Edit layout". Now you can shape your charts and tables via drag & drop.
In case you don't need your dashboard anymore, you can delete it any time.
How can I filter the data without changing my dashboard?
Set a filter to see your KPIs for a specific time period - without changing the default settings in your dashboard.

Besides the time period, you can also set more filter. To do this select "Filter" and insert your personal criteria. Additionally you can filter by several criteria. For this select "+" and add more criteria.
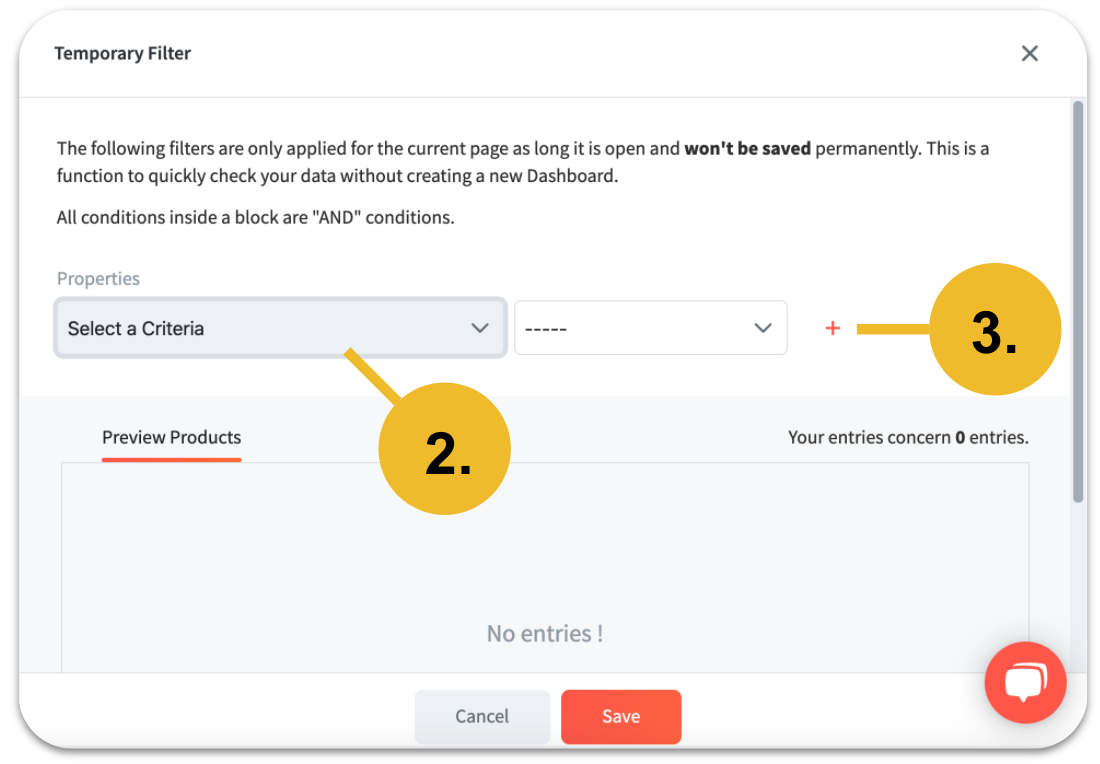
Note: You can check if there is any data available in the preview.
How can I export a dashboard?
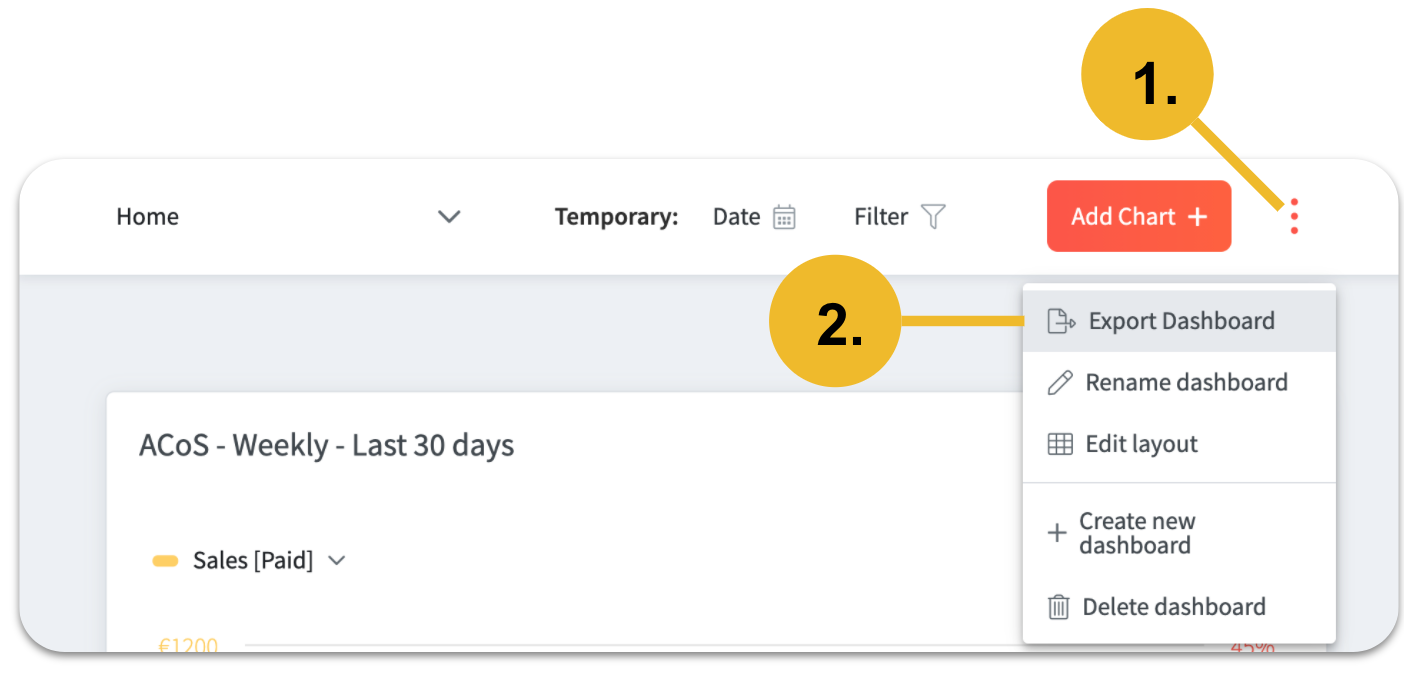
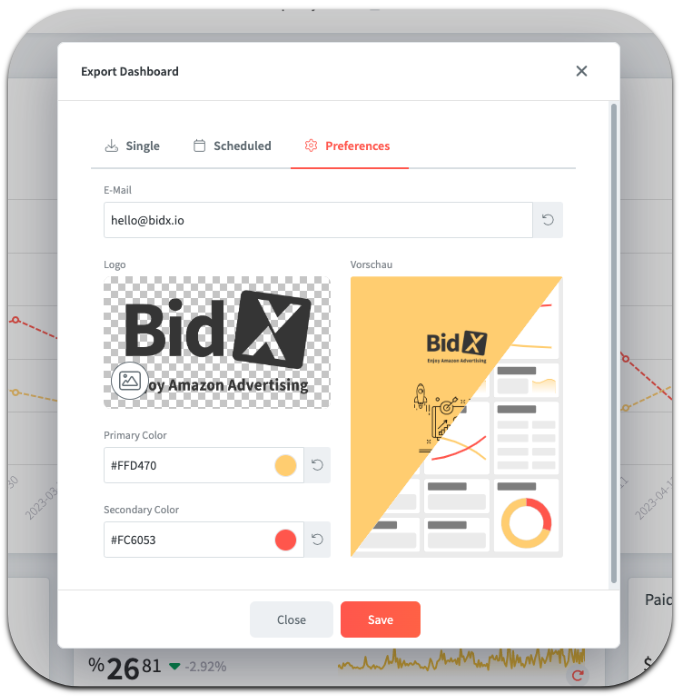
You can export your dashboard as pdf-file. Open the dropdown menu in the top right corner and select "Export Dashboard".
In the window that opens, in the area "Preferences", make your desired settings for the design and specify the email address to which the export should be sent to . This way you can also quickly and easily integrate your corporate design into the export. In this area you can also see a preview of the export.
Set the export title in the "Single" area and choose whether it should be sent by email or whether a link should be generated for direct download. If a time period has been set via the temporary date filter, which should be taken over, check the box "Apply temporary date range".
If you plan regular exports, select the affected dashboard in the "Planned" area. Also set the frequency (weekly or monthly) with which the exports should be sent. This is also possible for multiple dashboards at the same time.
Good to know: If the E-mail address differs from your account data you can use the address that you want the export to be sent to. This E-mail address will now be preset so that you don't have to change it every time you export your dashboard.